- SUI rallied 45% since its Tom DeMark 13 buy signal appeared on the weekly chart in July.
- SuperTrend indicator flipped bullish, pointing to a broader shift in SUI’s macro momentum.
- A close above $0.98 could trigger a third buy signal via the Parabolic SAR indicator.
- SUI’s parallel channel places the next target near $1.03, with $1.40 as the upper boundary.
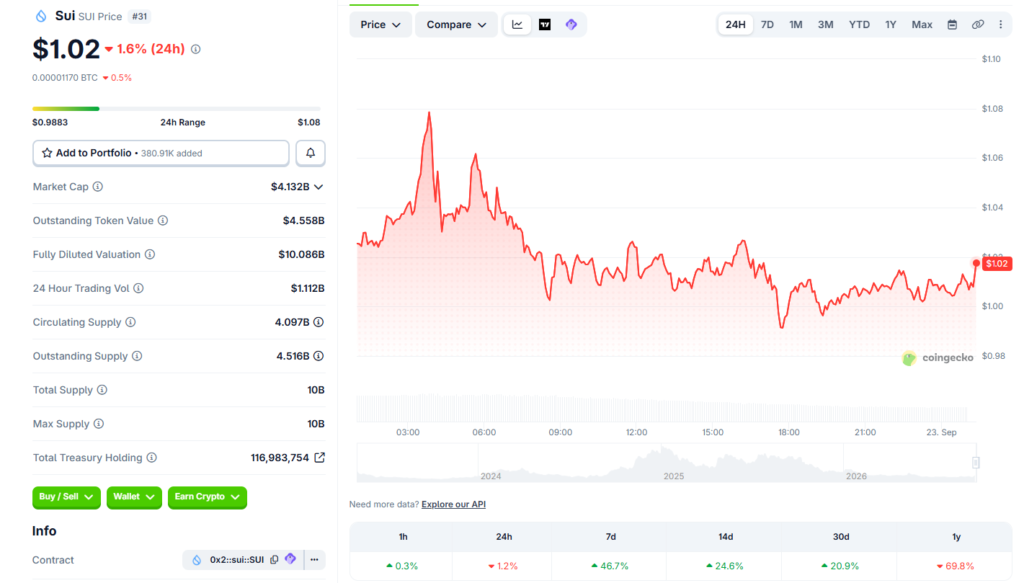
SUI is trading near $1.00 after a 24-hour trading volume of $1,112,388,865 as of writing. The token slipped 1.83% over the past day but gained 46.71% across the past week.
Analysts tracking the chart have flagged three separate technical signals pointing toward continued upside.
The convergence of these indicators has drawn attention from traders watching SUI’s weekly performance closely this month.
Technical Signals Point to Sustained Uptrend
SUI turned bullish on the weekly chart in late July when the Tom DeMark Sequential indicator printed a 13 buy signal. Analyst Ali Charts, writing on X, noted that SUI has rallied 45% since that signal appeared. The gain suggests the earlier reversal pattern carried real weight for price direction.
A second indicator has since confirmed the shift. The SuperTrend indicator flipped to a buy signal, according to the same analysis.
This development points to a broader change from bearish to bullish momentum on longer timeframes. Traders often use SuperTrend alongside other tools to confirm trend direction before entering positions.
A third signal could arrive this week through the Parabolic SAR indicator. Should SUI climb above $0.98, the SAR dot would shift below the price.
That move would confirm an uptrend and could function as dynamic support going forward. Three converging buy signals within weeks of each other is relatively uncommon for a single asset.
Chart Structure Suggests Upside Targets Ahead
SUI is also trading inside a parallel channel in the weekly chart, based on the analysis given. The formation provides a trading opportunity for traders to spot resistance and support areas for the near future.
The midpoint of the channel is around $1.03, which would be the first target level in case of an upward price move.
A breakout above the midpoint would bring attention to the upper border of the channel. The upper border is near $1.40, based on the chart pattern mentioned in the analysis. Such a price move would be rather significant compared to the current price action.
An impressive 7-day increase by 46.71% shows the presence of bullish pressure. If the third buy signal triggers at $0.98, sentiment can become very positive during the coming periods.

Sharron Kendi
Sharron Kendi is a seasoned crypto market analyst and writer with over three years of experience decoding blockchain trends, price movements, and market dynamics. She holds a Bachelor’s Degree in Commerce (Finance) from Kenyatta University, blending a solid academic foundation with a sharp eye for technical analysis and a deep understanding of on-chain data. Her work delivers clear, data-driven insights that empower investors to navigate the fast-evolving digital asset space with confidence.